
Voters 1
50kW stations show too long charge times, (corresponding to a much lower charge power of 30-37kW)
- User Feedback
- Subscribe
 |
Tomáš Komárek |
All 50 kW stations I tried to use in my plan show too long charge times (with multiple different cars and of multiple different providers i tried). The times would correspond to a much lower charge power of 30-37kW (depending on circumstances and station chosen, even with the same car).
I'm aware these stations are typically limited to 125A, meaning most cars cannot really draw full 50kW. Only a few cars with higher pack voltage (within the 400V architecture) can do it, like my e-208 that can pull 50kW from about 20% onwards as the voltage exceeds 400V. I can confirm that was the case when I actually used the same 50kW stations that report too long times. I got 50kW.
Anyway, most cars are able to pull somewhere between 40-45kW when limited to 125A. The time currently reported by ABRP is way too pessimistic for all of them.
Workaround: setting the charge power to 50kW manually in the relevant field in the plan results in a much better estimate (about 48kW when calculated from energy/time).
Proposed solution:
Simple: set the real charge power used in the calculation to 50kW, or around 45kW, as a middle ground.
Complicated: Keep information about nominal pack voltage for each car and adjust the power accordingly based on the expected (or known) current limit. Alternatively, log how fast each car charges at 50kW stations and use that for the car model at all 50kW stations.
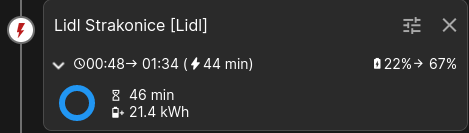
Note that I used the actual charge time, not counting into it the charge stop overhead (set to 2min). For the included screenshot, from the charged energy and time spent information:
21.4[kWh] ÷ (44/60)[h] = 29.2[kW].
I tried modifying the starting and outside temperatire too, just in case it was expecting a cold battery. The problem remains even when the plan uses summer temperatures.
Activity Newest / Oldest
Morin_ABRP
We've updated the voltage curve of the e208. It was a bit low so charge time are a bit faster now. For now we'll keep current limits on the chargers we have. Let us know if there's anything else.
Tomáš Komárek
Thank you for letting me know the change, I'm glad to be able to help refine your data.
It does not seem to help really (see fresh attempt in screenshot, again giving under 30kW), so the current limits at the chargers are probably the problem. That seemed more likely when you mentioned that you actually keep the voltage curves and current limits for each car/charger, as the issue is not isolated to one car only.
For now I will keep the habit of inputting 50kW as the charge speed manually to override it. Faster chargers (150+kW) seem ok, they overestimate the time needed only slightly.
Morin_ABRP
Ah, sorry. Turned out this update hadn't gone out to production yet, it got baked in with similar updates for more vehicles. I will notify here when they're released.
Morin_ABRP
The fix is out now.
Tomáš Komárek
I happen to have some data from CarScanner that I can provide!
drive.google.com/file/d/12JGA7gxqDDOwhMdZldfQ2UL6TDlFhdzo/view?usp=drive_link
The dataset is also on the plot in first screenshot for quick reference; starting point is 90%, driven down to 8.5% and then charged at Lidl Podebrady 50kW to 70% and some more driving. Pack temperature was around 25-30°C during the charge session.
Time spent was about 33 minutes with a total of 25.4kWh added (energy content change in the pack according to BMS). Station dispensed a bit more, 27.2kWh, the difference went into the cooling system running, and some energy was also lost to heat inside the battery. At the station side, it adds up to ~44.5kW average (includes ramp-up and time before reaching full speed around 25%). Stats from station are in second screenshot.
Looking at the Car Scanner data, it was able to reach near 50kW (disregarding fluctuations that go even beyond) before the need for stronger cooling kicked in at about 20%, visible as a slight decrease of charge power in the data. The actual draw from the station did not decrease and once it reached 50kW it stayed there the entire time.
The last screenshot is when I try to plan a route though there, it gives me ~30kW, while if the limit was 100A, it would be at least 40kW average. So the current limit must be set even lower in ABRP data, or something else is at play.
In general, the pack configuration is 108s2p with NCM cells. So quite many cells in series. From my experience, with nominal cell voltage of ~3.7V, this means the pack voltage is almost exactly 400V at 50% SoC. But this is in steady state, when charging, the voltage is higher and when discharging during a drive, it is lower. In case of a 50kW charger, it reaches 400V already at about 25% SoC (this being the threshold for 50kW at 125A stations) and seems to be in general about 14V higher than the steady state.
This applies only to the 2020-2023 e-208, the newer one has a bit bigger pack capacity with lower voltage.
I have yet to find a 50kW charger from any of the major providers in Czech Republic (ČEZ, E.ON, PRE, Lidl) that cannot give me 50kW.
I saw some like this abroad though, even limited to 80-90A, so it's not clear cut and I understand that global application of 125A might not be feasible. But those were not advertised as 50kW, so it might actually be ok to assume 50kW -> 125A.
(I guess it should be on the providers not to advertise stations as 50kW if severely current limited and no car can really get that, right? Even the 100A limit means no more than 45kW with the typical 450V limit.)
As for the 100A limit, even that should give me 40+kW, not 30 as the plans often do. Like the one on the third screenshot. And that is exactly the station where I recorded the data at 50kW, proving it's definitely 125A.
Some more details:
For reference, my SoH was about 95% (included in the data), very typical for e-208 after a year or two (it pretty much stabilizes around there, further decay is very slow).
When full, the pack voltage is about 443V (cell voltage ~4.1V). This is perfect, since it still allows for charging with a typical 450V limit the chargers have, not cutting off early.
Tomáš Komárek
I also have another session that might be useful, going up to 90%. But that was on a cold battery (8°C start, 17°C end), so it's more complicated to use. But the top part could possibly be used as a guideline and spliced onto the previous dataset to extend it into higher SoC. And 443V is the steady state 100% SoC, which I now confirmed is exactly right.
Another thing to note here are the very visible HV jumps up and down as the charge power changes, which would not be the case with a warm pack and the HV is overall slightly lower than it would be at 50kW power. Not sure how your HV curve models are implemented, but they should take into account the charge-induced pack HV increase if you aim for maximum accuracy. That might be a bit different across packs and definitely changes across charge power or current variations (maybe related to internal resistance?).
drive.google.com/file/d/12n81Y8YFGaX8NwkTZ0yk3fsPuehK-w3W/view?usp=sharing
Morin_ABRP
I can't find anything obvious wrong with the voltage curve for the e208. However, looking at the source data for the charger in your example it seems like the current is limited to 100A (which is inline with the charge time of the example). Looking at all of our chargers, quite a big number of the 50kW chargers are limited to 100A. This doesn't really seem correct, we'll see about overriding the source data and assume that all 50kW CCS chargers has at least 125A max current.
Bo_ABRP
Status changed to: User Feedback
Bo_ABRP
We are already doing the complicated version, but based on what you write we may be a bit pessimistic in the voltage curve. We will check some examples with an e208. Do you have a voltage curve for your pack?
Linda
Status changed to: Investigate